
+60% historical CAGR
Built for bull and bear markets.
Trade across market cycles.
LS v3 Breakout · LS Pullback · Index Trend Following + Hedge
Built for bull and bear markets.
Trade across market cycles.
Grow wealth and have a life.
A clear end-of-day process.
Know what to do and when.
No discretion, no stress.
LS v3 Breakout + LS Pullback + Index Trend Following + Hedge
Historical model · January 3, 1995 – June 30, 2026. Frozen Portfolio T updated October 17, 2026 · Index Trend Following + Hedge. Historical results are separate from Felipe’s live track record.
Equity curves rebase the first recorded close to 100 and use a logarithmic scale. Returns and drawdown include the first session’s change from starting capital. Compare Portfolio T and SPY, or switch the plotted measure. SPY uses adjusted closes over the same date range.
Historical model returns · January 3, 1995 – June 30, 2026. Portfolio T includes leverage and specified costs. QLD history before June 21, 2006 is synthetic; NDX proxies the QQQ hedge before March 10, 1999.
The QQQ hedge takes priority when triggered. LS v3 Breakout then leads the stock book, followed by LS Pullback; QLD follows the weekly trend.
Swipe to explore the diagram.
Stock capacity: 170% hedged · 210% QLD unhedged · 250% QLD cash. QLD target: 35% · QQQ short: 40% at entry.
The first valid consolidation after the first leg of a move, followed by a decisive breakout.
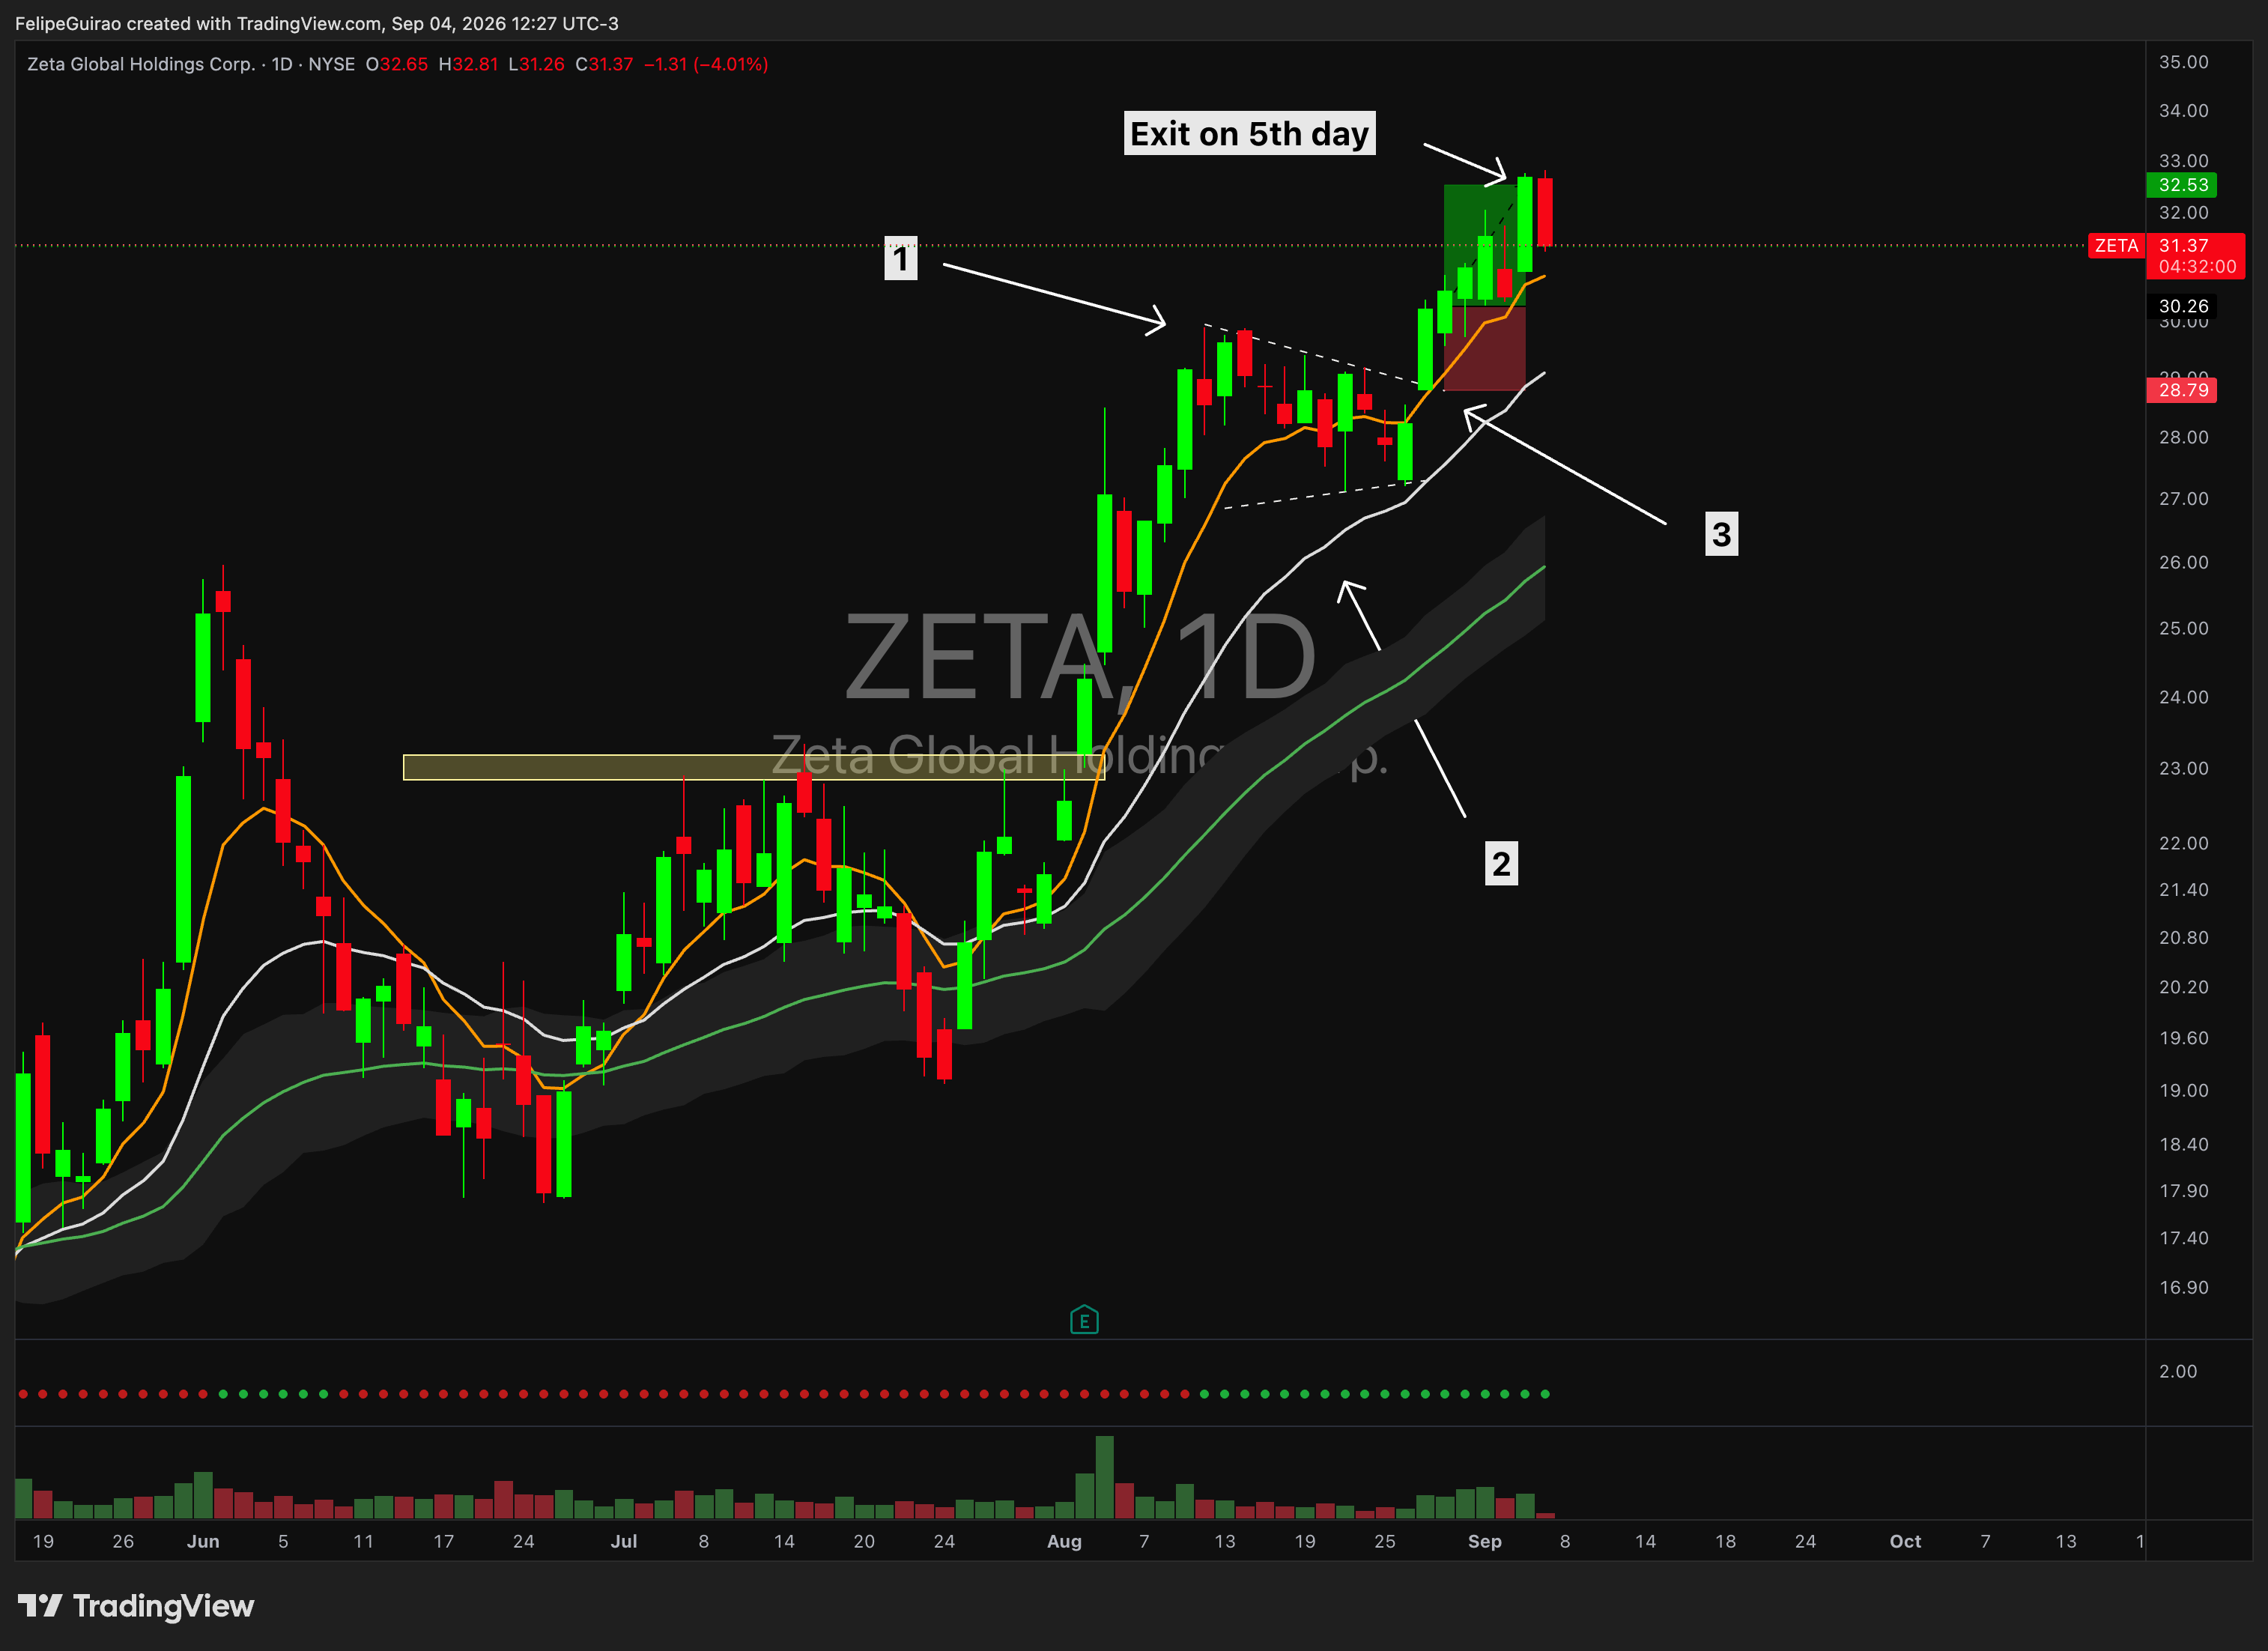
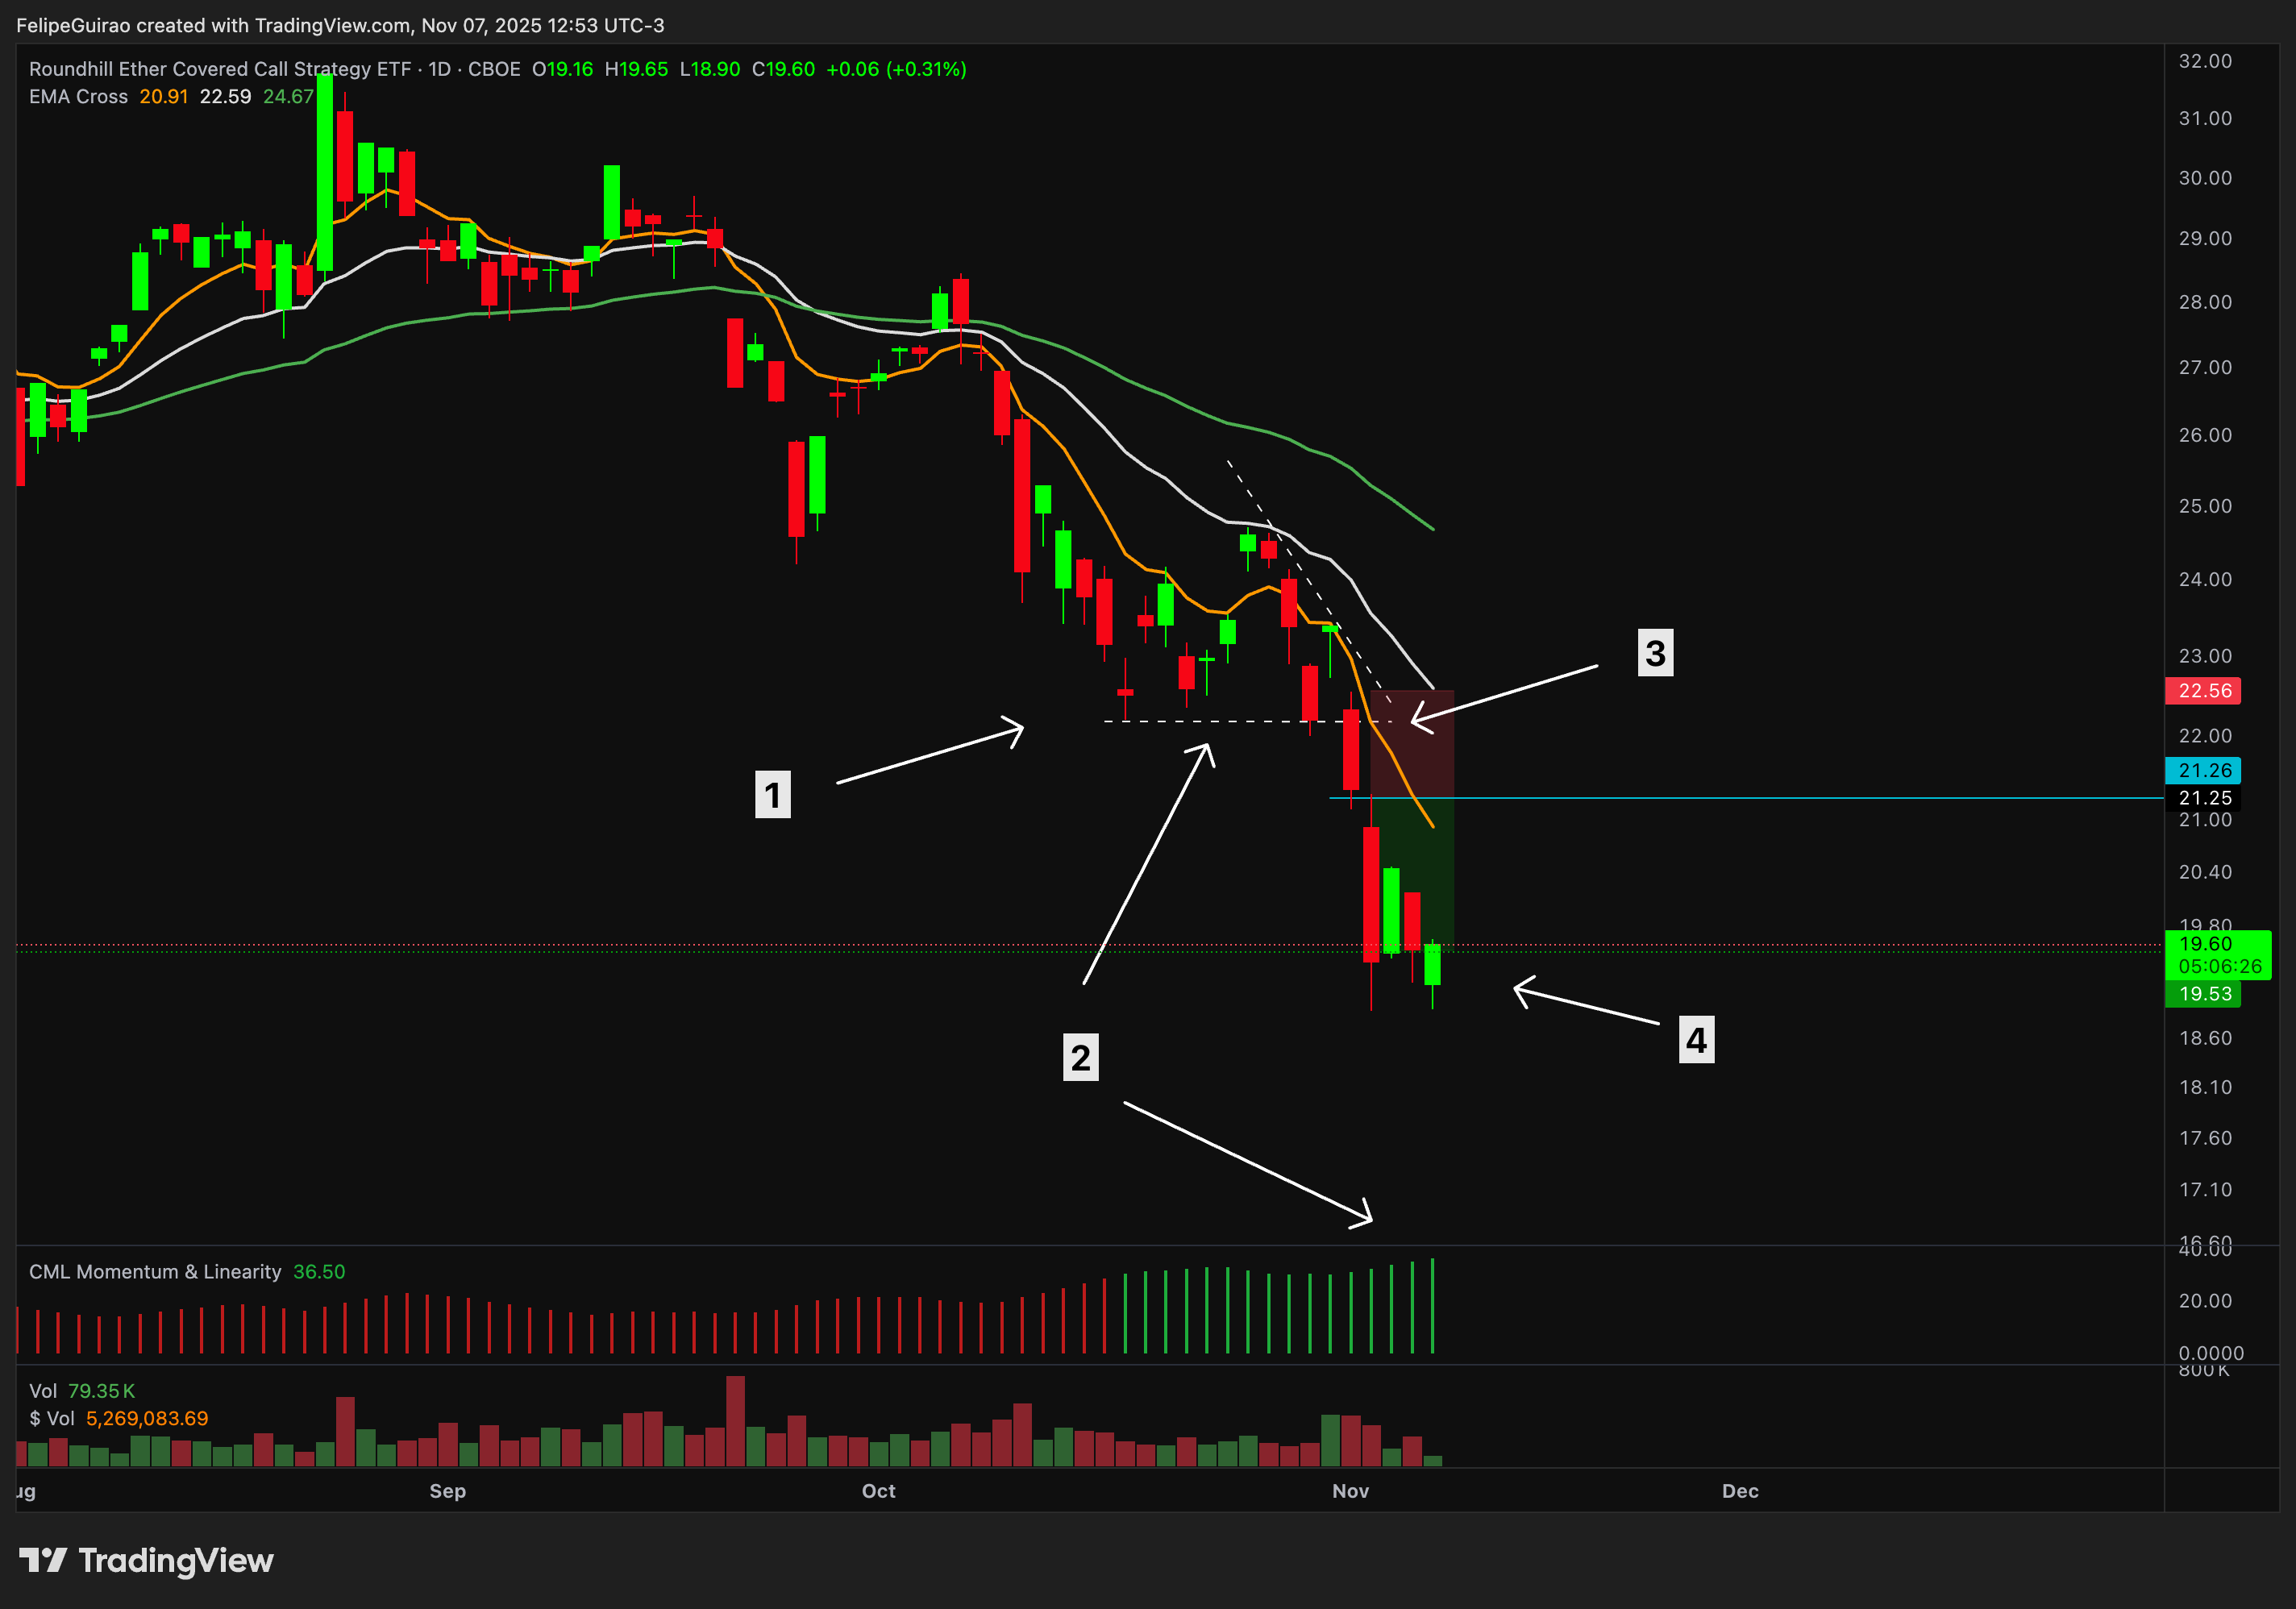
Short setup: Reverse the price structure: downward EMA stack, lower highs, no daily close above the 20 EMA, and a strong candle with no lower wick breaking and closing below support. CML must still be green.
The same long-only pullback structure is applied on daily ETF candles and weekly ETF or Nasdaq-100 candles.
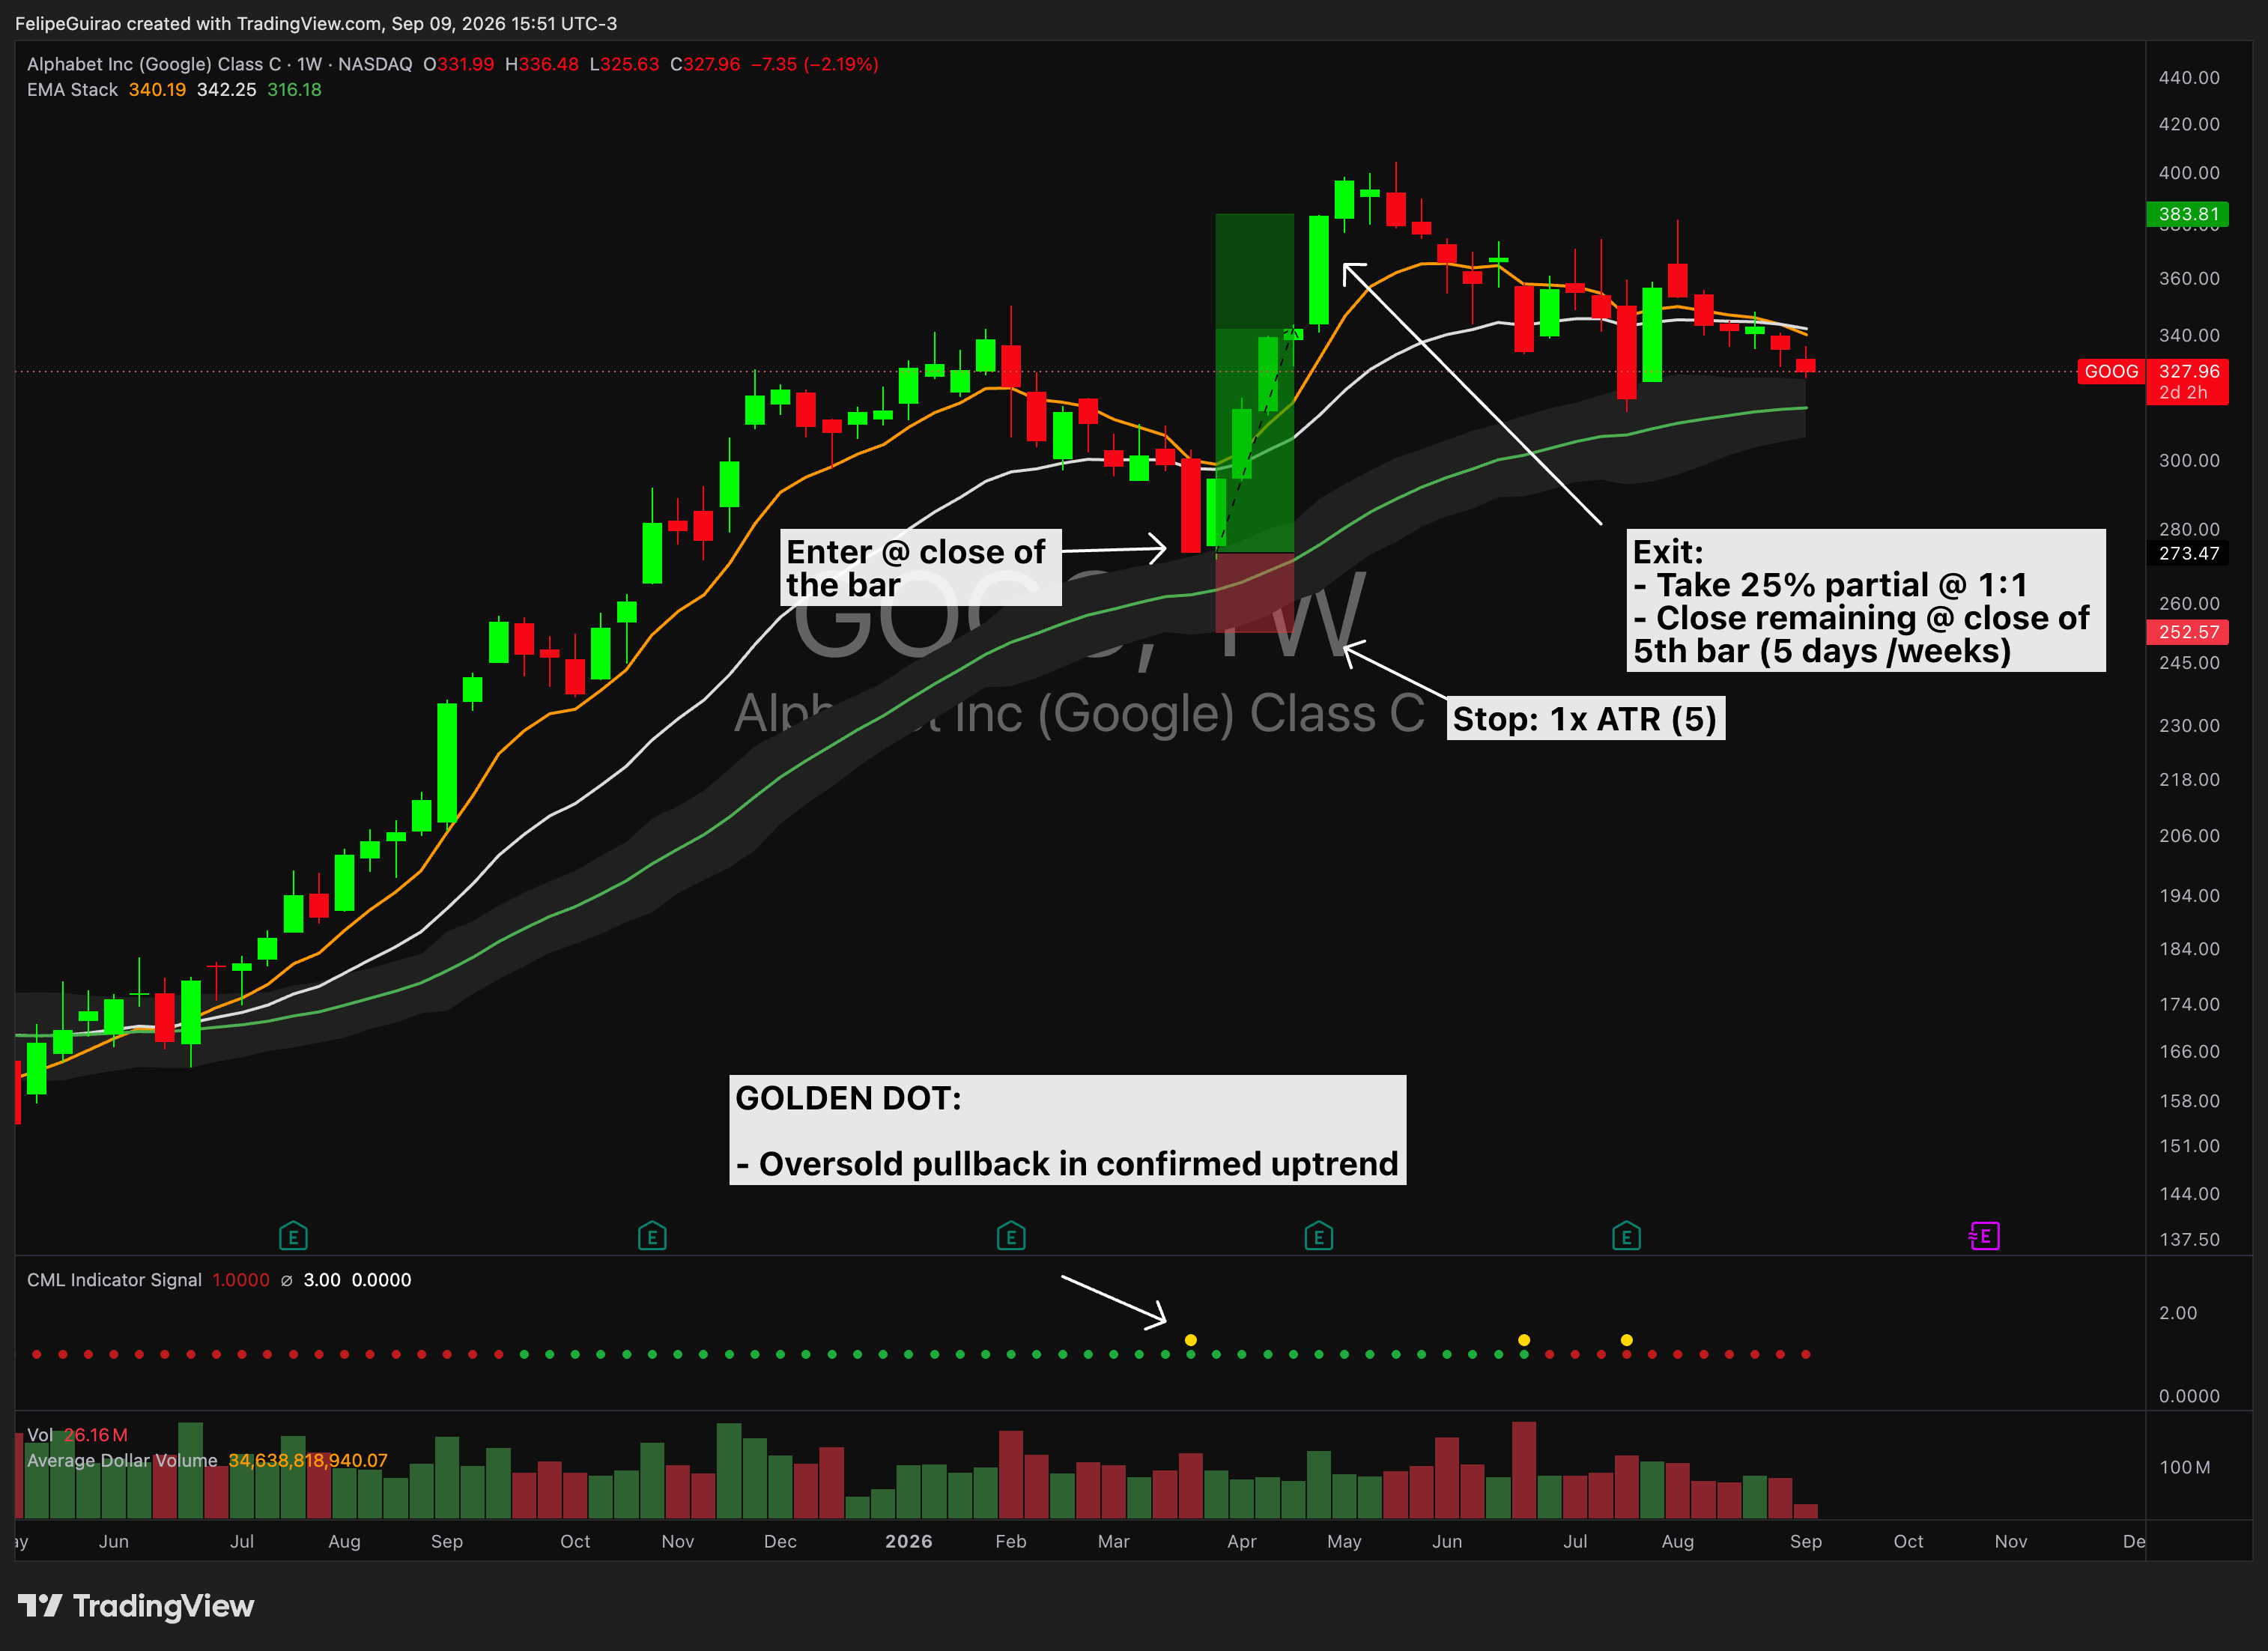
19 major liquid ETFs: SPY, QQQ, IWM, DIA, MDY, XLK, XLF, XLE, XLV, XLI, XLY, XLP, XLU, XLC, SMH, SOXX, IBB, XRT and ITB.
Stocks: Nasdaq-100 component stocks.
European traders: You can run CFDs on these instruments. Because the list focuses on major, liquid equity ETFs, the setup experience should be comparable.*
* CFD availability, pricing, spreads, financing, trading hours and tax treatment vary by broker and jurisdiction.
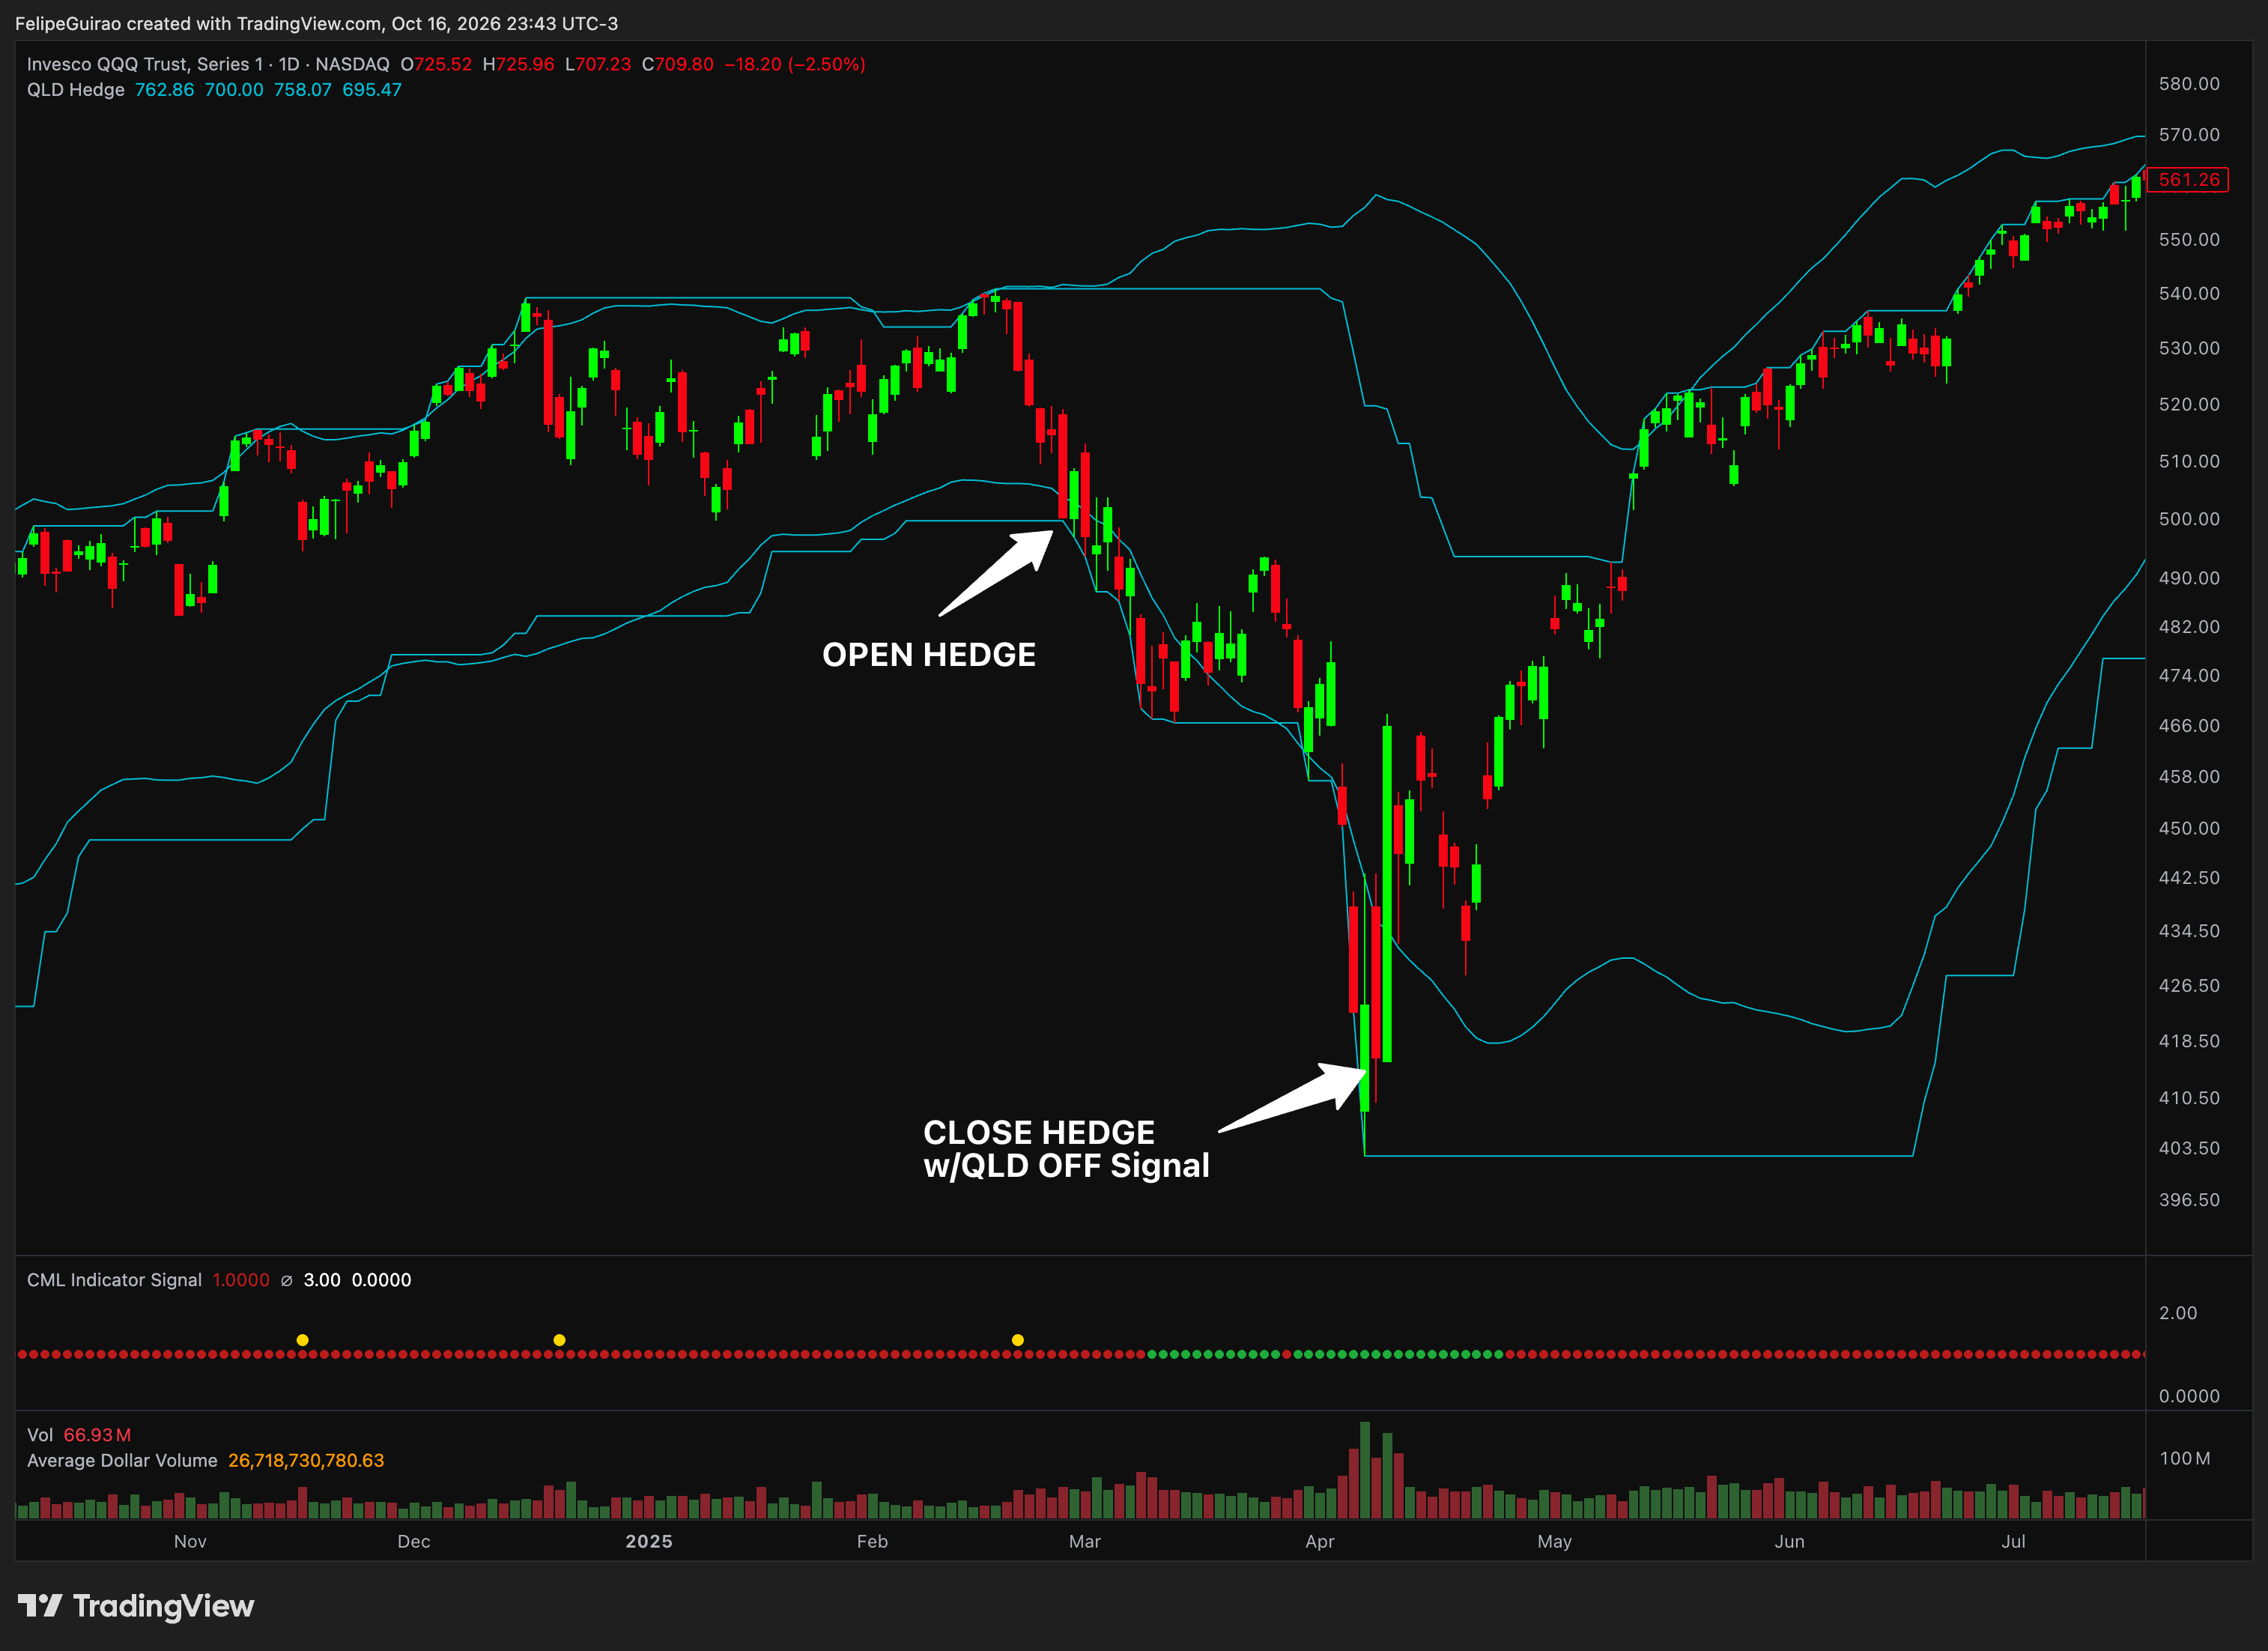
A weekly QQQ trend signal traded through QLD, paired with a 40% QQQ short that responds to daily weakness. QLD targets 35%, with monthly rebalance checks.
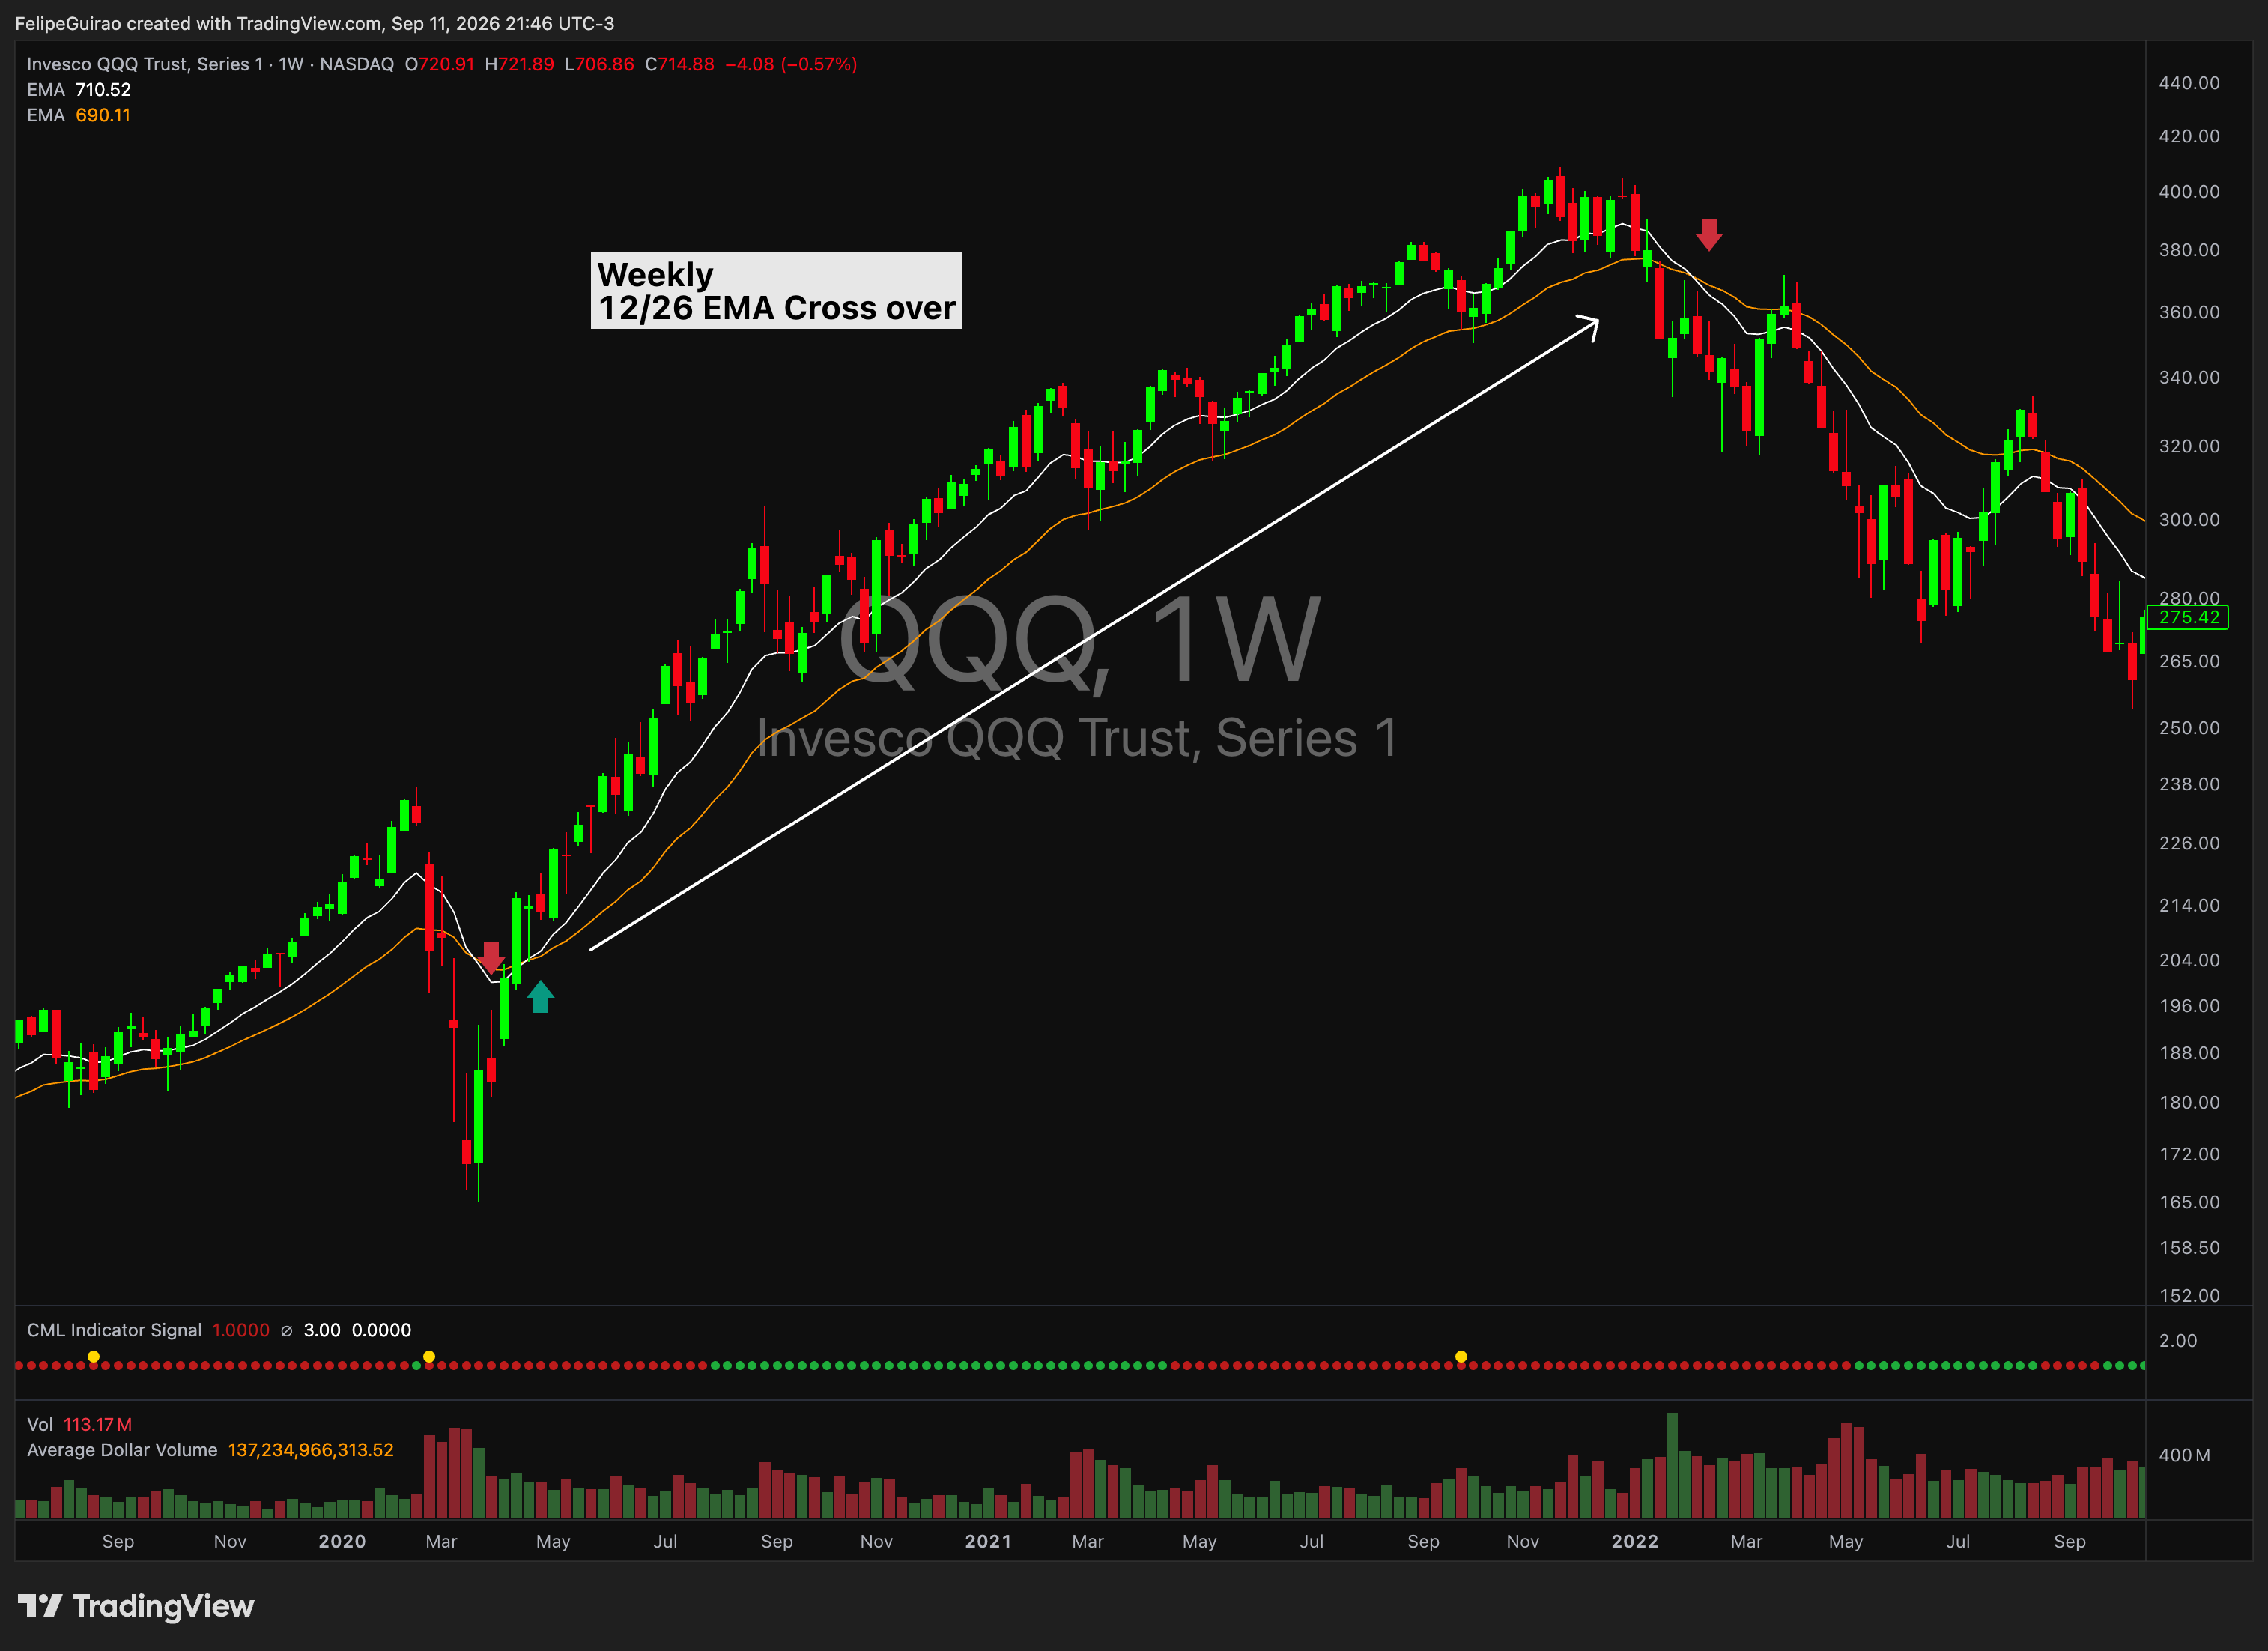
| Position | Short QQQ shares at 40% of account NAV at entry, after reclaiming capacity. Keep the shares fixed until exit. |
|---|---|
| Weekly gate | Open the hedge only while the completed weekly QQQ EMA12 is above EMA26 and QLD is ON. |
| Daily trigger | QQQ’s Low reaches the lowest Low of the preceding 50 sessions, or touches the lower Bollinger Band: SMA(50) − 2 standard deviations. |
| Entry | Short at the daily close of the trigger candle. Hold one hedge at a time; an active closing exit blocks entry. |
| Stop | Fixed GTC stop at entry Close + 2.5 × Wilder ATR(5), active after entry. No trailing. An opening gap fills at the Open; otherwise a High touch fills at the stop. |
| Exit | Exit when any of these trigger first:
|
| Capacity | Reserve 40 points of gross booked capacity: the stock cap is 170% while QLD and the hedge are held. Reclaim from LS Pullback first, then LS v3 Breakout, largest positions first. Short proceeds do not add capacity. |
The 50- and 30-session price channels exclude today. BB(50,2) uses the completed current Close and population standard deviation. No breadth filter or breadth exit.
Usually, the weekly decision is made Friday after the close and executed Monday at the open. Use the final trading close and next available session when holidays intervene.
Weekly signal changes and monthly allocation checks are separate. Review the daily account value, but only the month-end band check triggers an allocation rebalance in frozen Portfolio T.
Monthly changes in closing account equity, including open positions. The 2026 total compounds January–September and matches the annual comparison below.
Portfolio T · 2026 YTD through September 28, 2026.
Portfolio T live tracking began September 2026. All cells show the current hedged model simulation.
| Year | Jan | Feb | Mar | Apr | May | Jun | Jul | Aug | Sep | Oct | Nov | Dec | Year / YTD |
|---|---|---|---|---|---|---|---|---|---|---|---|---|---|
| 2026 | +10.2% | +3.6% | -7.9% | +14.9% | +4.3% | +11.4% | -3.7% | -0.1% | -5.7% | — | — | — | +27.4% |
| 2025 | +7.8% | -4.9% | -6.5% | -1.9% | +0.3% | +37.2% | +2.6% | +4.0% | +16.1% | +12.6% | -5.9% | -4.2% | +62.7% |
| 2024 | +9.3% | +6.9% | +12.1% | +0.8% | +11.3% | +12.2% | +6.1% | -8.1% | -4.1% | +6.5% | +8.6% | -6.1% | +67.6% |
| 2023 | +1.3% | +0.9% | +10.9% | +3.5% | +5.3% | +13.1% | +25.6% | -1.9% | +5.7% | +1.6% | +9.9% | +38.4% | +181.1% |
| 2022 | -4.1% | -1.2% | +2.5% | +4.3% | +0.0% | +17.5% | -3.2% | -5.4% | +5.8% | +2.1% | +9.5% | +0.0% | +28.9% |
| 2021 | +16.7% | +30.2% | -4.8% | +13.9% | +1.2% | +10.9% | +0.5% | +10.1% | -5.9% | +8.8% | +2.4% | -2.3% | +109.2% |
| 2020 | -3.6% | +13.7% | -6.3% | -1.2% | +10.4% | +31.5% | +18.9% | +15.7% | -3.6% | -1.8% | +18.0% | +44.7% | +227.2% |
| 2019 | +0.1% | +8.8% | -7.2% | +5.3% | -11.7% | +5.5% | +11.9% | -7.5% | -4.3% | -1.4% | +2.2% | +1.9% | +1.0% |
| 2018 | +15.1% | -4.8% | +0.1% | -0.3% | +1.8% | -7.1% | -0.6% | +8.8% | -1.4% | -5.0% | +0.1% | +20.4% | +26.3% |
| 2017 | -4.5% | +3.7% | +0.5% | -4.7% | +2.4% | -8.0% | +3.4% | -3.1% | +2.3% | +12.0% | +3.1% | +4.8% | +10.9% |
| 2016 | +15.8% | -1.9% | -8.7% | -1.0% | +0.5% | -0.9% | +1.3% | +6.4% | +2.6% | -3.2% | +1.9% | +3.4% | +15.2% |
| 2015 | -1.7% | +6.7% | -5.0% | +9.6% | -1.5% | -5.5% | +5.3% | -2.0% | +17.4% | -5.7% | -3.1% | -0.7% | +11.7% |
| 2014 | +6.1% | -0.1% | -8.6% | -2.1% | +2.5% | +3.5% | -8.9% | +5.4% | -1.9% | +9.7% | +12.8% | -4.1% | +12.6% |
| 2013 | +10.1% | +0.1% | +20.7% | -1.1% | +6.3% | -6.4% | +7.2% | -8.8% | +12.2% | +7.1% | +11.0% | +10.8% | +89.0% |
| 2012 | +13.8% | +0.4% | +1.7% | -3.2% | -5.1% | +1.5% | +2.4% | +2.5% | +9.7% | -2.4% | +3.8% | -0.7% | +25.5% |
| 2011 | +11.7% | +10.9% | -4.6% | +1.4% | -7.0% | +8.3% | -3.0% | -0.4% | +14.6% | +0.4% | -1.3% | +0.6% | +33.2% |
| 2010 | -5.7% | +4.5% | +5.7% | +18.9% | -1.6% | +7.2% | +2.0% | -4.1% | +2.9% | +13.9% | +7.7% | +18.2% | +90.6% |
| 2009 | +0.0% | +11.7% | -1.9% | +0.8% | +12.6% | -4.1% | +2.3% | +24.7% | +30.1% | -6.5% | +2.5% | +7.1% | +103.3% |
| 2008 | +0.7% | +8.3% | +8.1% | -1.8% | +20.5% | -0.9% | -1.6% | -1.0% | +1.9% | +0.0% | +0.0% | +1.9% | +39.8% |
| 2007 | -1.4% | -8.2% | +3.8% | +5.0% | +12.7% | +7.2% | +1.1% | +0.9% | +14.3% | +4.1% | -9.7% | +5.2% | +37.4% |
| 2006 | +11.6% | +0.5% | +7.2% | -2.5% | -7.5% | +10.7% | +6.5% | +5.1% | -1.2% | +1.4% | +12.2% | -2.1% | +47.7% |
| 2005 | -8.7% | +2.7% | +1.7% | -4.9% | +0.9% | -3.0% | +6.0% | -2.7% | +12.6% | -1.0% | +4.8% | -6.1% | +0.3% |
| 2004 | -2.7% | -7.9% | -1.8% | +0.7% | +2.4% | +5.9% | -10.0% | +4.5% | +6.4% | +6.5% | +6.0% | +5.7% | +15.0% |
| 2003 | -1.1% | +2.8% | +17.4% | +12.1% | +13.4% | +3.6% | +6.9% | +4.0% | -7.8% | +14.6% | +4.7% | +6.0% | +104.7% |
| 2002 | +1.6% | -0.8% | +3.8% | -1.6% | +0.0% | +14.9% | +2.7% | -3.1% | +0.0% | +2.2% | +9.6% | -3.9% | +27.0% |
| 2001 | -0.7% | -8.5% | +0.1% | +2.4% | +3.5% | -0.1% | +3.3% | +1.9% | +42.8% | -3.5% | +2.8% | +9.1% | +56.3% |
| 2000 | -14.1% | +57.9% | +8.4% | -10.9% | +10.8% | +4.0% | -15.2% | +26.7% | -7.8% | -4.7% | +1.2% | -1.7% | +41.8% |
| 1999 | +13.0% | -8.3% | +14.6% | +7.6% | -15.4% | +15.6% | -6.0% | +14.3% | +13.8% | +10.7% | +15.2% | +69.4% | +229.4% |
| 1998 | -0.0% | +3.0% | +6.6% | -1.2% | +1.2% | +24.1% | +17.7% | -6.6% | +7.5% | +14.7% | +3.6% | +38.2% | +164.4% |
| 1997 | +12.4% | -8.0% | -2.7% | +13.8% | +16.9% | +13.4% | +31.0% | +2.8% | +23.0% | -8.6% | +1.6% | -0.6% | +132.3% |
| 1996 | -0.7% | +0.9% | +0.1% | +28.1% | +12.0% | -7.8% | +1.6% | +0.4% | +11.8% | +3.8% | +35.1% | -9.9% | +91.0% |
| 1995 | -3.2% | +3.7% | +21.1% | +13.6% | +3.1% | +6.3% | +11.3% | -7.6% | +6.3% | +0.7% | -1.5% | -2.5% | +60.0% |
January 1995–September 28, 2026 · market context through September 28, 2026 · click an entry to open its trade charts.
Accepted stock entries, QLD timing arrows, hedge ON/OFF below the SPX candles, and monthly account returns from the new frozen Portfolio T. The hedge indicator shows the position after each cash-session close.
Trade Portfolio T with Felipe. Get the signals, the process and full Strategy Hub access.
Start Your 3-week Trial